Cyclist Safety in NYC
Technologies: Python, Plotly, Dash, Pandas, Flask,
Carto & OpenStreetMap, HTML & CSS
This is a dynamic, interactive data application accessing an NYC
Open Data API endpoint, which I built during the Data Visualization
Society's mentorship program in Spring 2025, and later deployed with
PythonAnywhere.
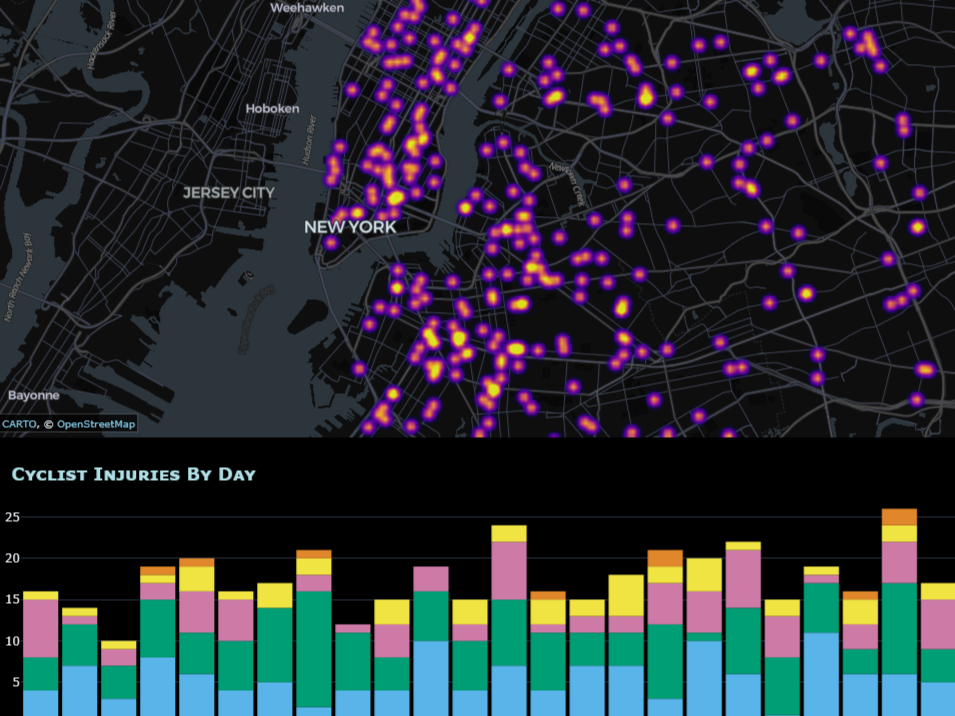
The app is live and free to use. View here.