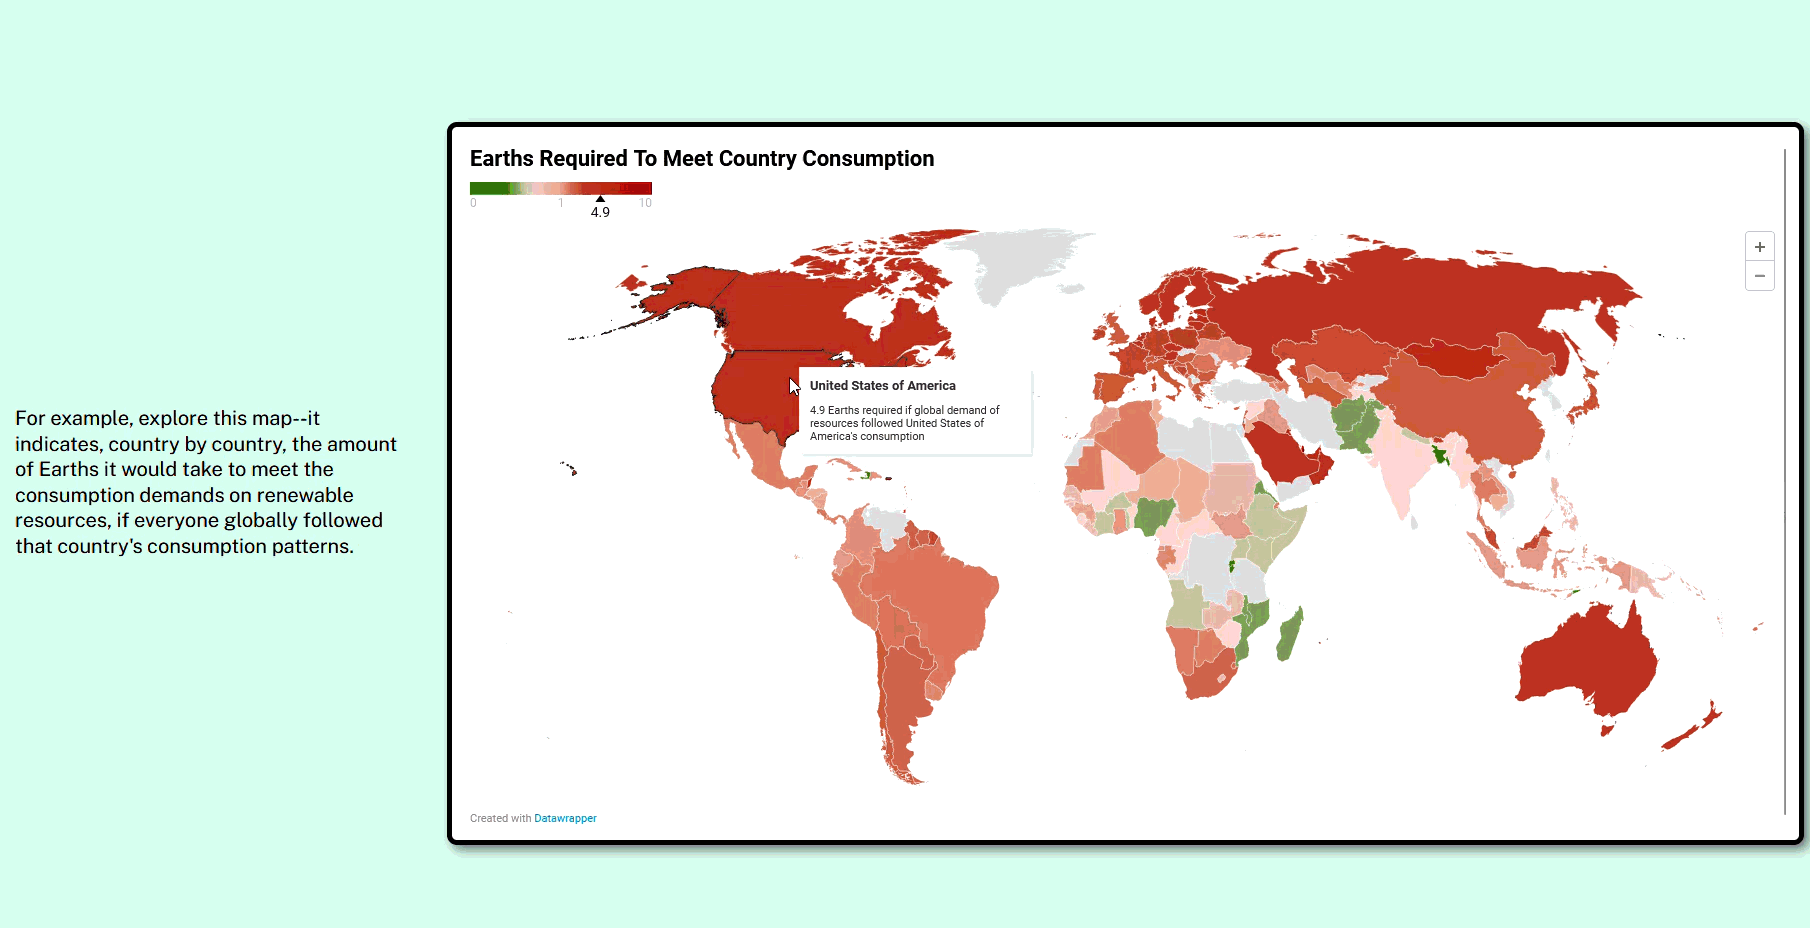
What Is Earth Overshoot Day?
Technologies: Scrollama.js, Datawrapper, Scimago Graphica,
Apache Echarts, HTML & CSS
This is a data-journalism explainer piece I developed while learning JavaScript scrollytelling, using Russell Samora's Scrollama.js library. (with the help of Jonathan Soma's great Scrollama tutorials)
This project is a result of the "Future Fridays" bimonthly series hosted by UK data studio Infogr8 in partnership with the Data Visualization Society.
I used a variety of interactive charting tools, from no-code to bespoke JavaScript, and the one I was most excited to try out was the Scimago Graphica app, developed by the SCImago data-research collective.