Urban Futures 2026
I was invited to the "Urban Futures" hackathon in January 2026, organized by the LEAP Science and Technology Center at Columbia University, and hosted at the American Museum of Natural History. I got to present the project in the AMNH Planetarium!
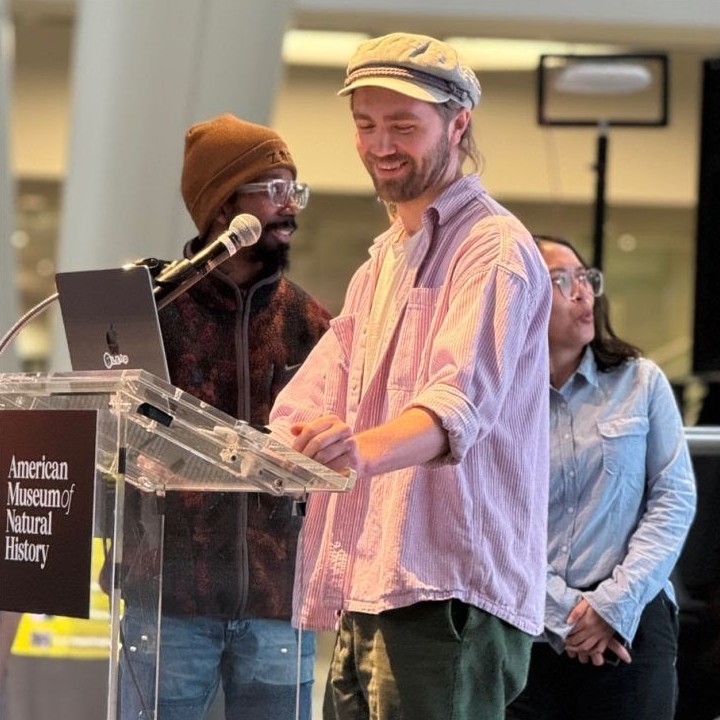
Over 3 days, I collaborated with a team of urban planners and data scientists, and in collaboration with a community leader representing the Stapleton neighborhood of Staten Island. We worked to develop a ground-level community solution to persistent flooding within Stapleton. Our team was guided by Mark Bauer, and comprised of myself, Milka Vincentiya, Devon James, and Marilyn Moy.
We visualized the flooding and pitched a two-pronged solution. First, we suggested the installation of additional FloodNet sensors in the most flood-prone areas of the neighborhood of the neighborhood-tablulation-area (NTA) of Stapleton. Then, we proposed installing flood-warning dashboards on existing LinkNYC digital kiosks in the area, for real-time emergency preparedness and response.
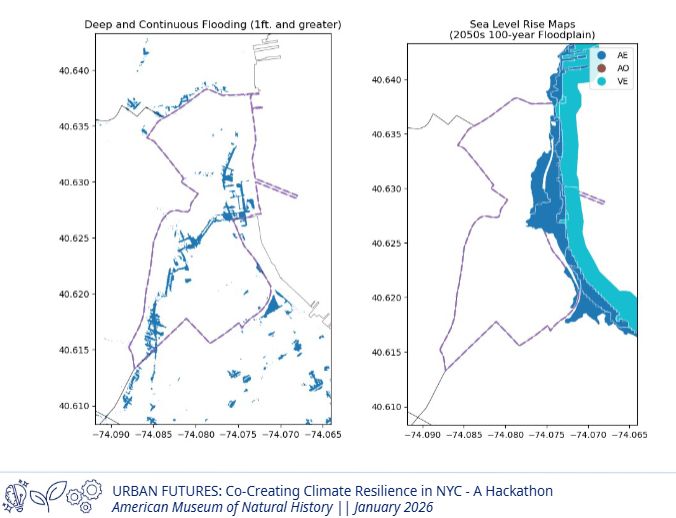
After some cursory analysis of flood patterns in GeoPandas, and exploring the Stapleton area's topography, we narrowed our approach to address pluvial flooding (flooding from rainfall)rather than coastal flooding. This was important to establish because 3 out of 4 existing flood sensors in the area are along the coastline, and we wanted to advocate for additional sensor placements further inland, near the base of a ridgeline which exacerbates flooding along a main commercial street.
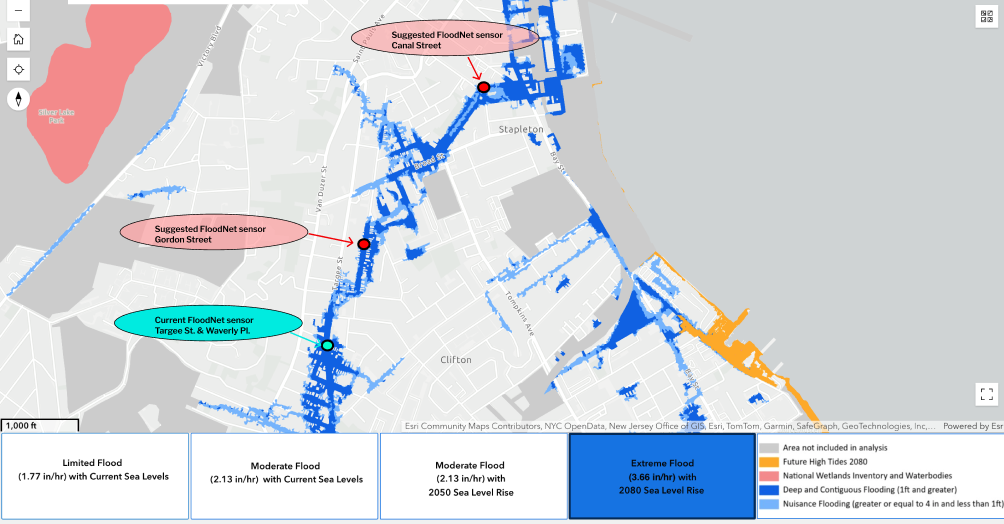
One prescient piece of feedback (in my opinion) we received from the panel we presented to was about our suggested locations for new sensors--how did we decide where to place them? A very worthy question. In truth, we hadn't taken the time for a developed and precise methodology for determining new sensor placement. To us, it seemed obvious where they should go, just based on the map.
So, in the time since the hackathon, I've been pursuing a
data-informed approach for making suggestions for new sensor
placement. I've learned QGIS, and iterated a few different maps
using NYC Open Data's available packages on citywide
elevation
and
surface permeability. The map below displays Stapleton shaded according to each area's
"runoff score," which is
(Max Elevation − Current Elevation) * (Percent Impervious /
              100)
. This helps determine areas where flooding has high potential
based on physical characteristics of the terrain and how the land is
used. Determining the potential for runoff is important for pluvial
flooding, contrasted with coastal flooding, because we want to
identify areas where water is likely to pool and stagnate, which is
what's happened perenially in Stapleton's commercial streets.
I'm glad to note that this analysis for runoff corroborates what we'd pitched back in January, and adds some more rigour to our project and better-justifies the suggestions we came up with.
Next steps: As I go further with GIS, I'm continuing to develop this work, and will bring elevation, surface permeability, and flood prediction modelling together for a robust deliverable. The Stapleton community leader we worked with is in talks with his constituency and the NYC Mayor's Office about realizing this work, which I'm honored to have had a part in.